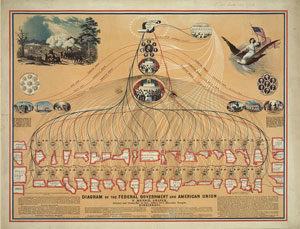
Diagramming the Federal Government

DiagrammingFederalGovernment

Overview

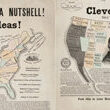
Students analyze data from an historical diagram of the U.S. federal government, then research infographic design and explore types and methods of presenting data to help facilitate understanding by a modern-day audience.

Related Resources

Grade

High School

Subjects

Civics, Math

Length

40-60 minutes

Topics

data analysis, diagrams, federal government, government structure, guided primary source analysis, infographics, statistics, u.s. government
Author

Primary Source Nexus

More Lessons

Politics: Everybody’s Doing It!

By Primary Source Nexus

Does the Camera Ever Lie?

By Primary Source Nexus

United States: Biggest Business in the World

By Primary Source Nexus

Electoral College: Does Your Vote for President Count?

By Primary Source Nexus

Bonus Veterans

By Primary Source Nexus

Lessons for My Community

By Primary Source Nexus

The Constitutional Amendment

By Primary Source Nexus

Everybody’s Doing It!

By Primary Source Nexus

Celebrating America

By Primary Source Nexus

Stop Bullying with Data Percentages

By Citizen U DePaul

Why We Can’t . . .

By Primary Source Nexus

Party Factions

By Primary Source Nexus

Women’s Rights: Seneca Falls & Beyond

By Primary Source Nexus

At School

By Primary Source Nexus

Engine Company 54 lost 15 men, 9/11/01

By Primary Source Nexus

Chinese Citizenship in Hawaii

By Primary Source Nexus

Presenting Party Platforms

By Primary Source Nexus

I Am an American Day

By Primary Source Nexus