Lesson Plans
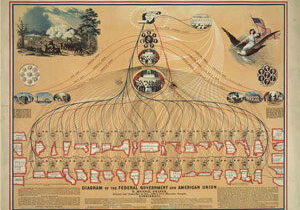
Diagramming the Federal Government
Students analyze data from an historical diagram of the U.S. federal government, then research infographic design and explore types and methods of presenting data to help facilitate understanding by a modern-day audience.
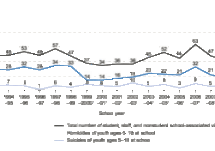
Data Analysis to Drive Civic Action
Students consider civic action through primary source analysis, then examine and interpret data and use knowledge of civic life, politics, and government to discuss potential civic engagement.
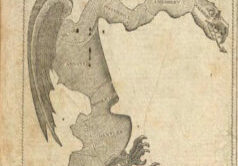
Gerrymandering: Voting by Numbers
Students learn about the application of ratios and proportions to the real political issue of gerrymandering. In Part I, students conduct a primary-source analysis of the original 1812 political cartoon about Elbridge Gerry’s redistricting in Massachusetts to build background knowledge. In Part II, students analyze a historical map of Massachusetts’s gerrymandered voting districts in 1812 and compare it to the political cartoon to discuss issues of fairness. In Part III, students solve a hypothetical problem about fair representation on a student council, using their knowledge and understanding of gerrymandering and ratios. Finally, students role-play state legislators in a hypothetical state to solve problems of representation, including gerrymandering.
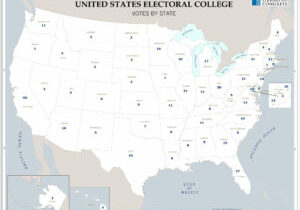
Electoral College: Are All Votes Equal?
Students examine the process of voting and the Electoral College. Applying mathematical percentages, students experience how population and voting impact elections in this country and consider if everyone’s vote matters. Then students consider the use of the Electoral College and how it aligns with the popular vote.

