Lesson Plans
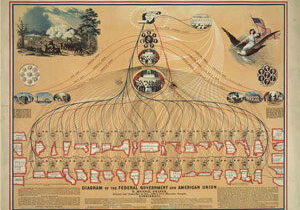
Diagramming the Federal Government
Students analyze data from an historical diagram of the U.S. federal government, then research infographic design and explore types and methods of presenting data to help facilitate understanding by a modern-day audience.
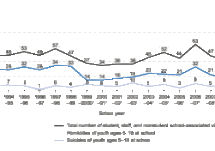
Data Analysis to Drive Civic Action
Students consider civic action through primary source analysis, then examine and interpret data and use knowledge of civic life, politics, and government to discuss potential civic engagement.
Search
Subjects
Civics(3)
Math(3)
Grades
High School(2)
Elementary(1)


