Lesson Plans

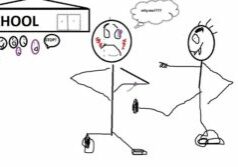
Graphing Bullying Data to Create Change

Students define types of bullying through primary source analysis and use skills in of calculating percentage and graphing to examine data on bullying. Students then create a poll for the school community that would provide data on bullying in the school. As a follow up, students can implement the poll and create reports and solutions.

LEARN MORE about Graphing Bullying Data to Create Change

Stop Bullying with Data Percentages

Students use percentages to examine data on bullying while building civic skills of explaining and analyzing information and arguments. Using previous knowledge of fractions and percentages, students examine current data about bullying from the CDC. Students then create a campaign for the school community that would provide data on bullying in the school. As a follow-up, students can present their campaign to the larger governing bodies in their schools.

LEARN MORE about Stop Bullying with Data Percentages

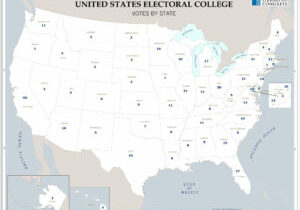
Electoral College: Are All Votes Equal?

Students examine the process of voting and the Electoral College. Applying mathematical percentages, students experience how population and voting impact elections in this country and consider if everyone’s vote matters. Then students consider the use of the Electoral College and how it aligns with the popular vote.

LEARN MORE about Electoral College: Are All Votes Equal?

Search

Subjects

Grades

Authors