Graphing Bullying Data to Create Change

Overview
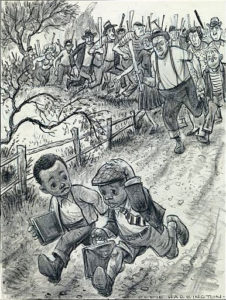
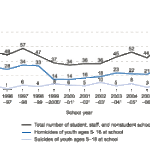
Students define types of bullying through primary source analysis and use skills in of calculating percentage and graphing to examine data on bullying. Students then create a poll for the school community that would provide data on bullying in the school. As a follow up, students can implement the poll and create reports and solutions.
Related Resources
-
More Math Resources
Lesson plans, activities, primary source sets
Grade
Middle School
Subjects
Civics, Math
Length
60-80 minutes
Topics
CDC, Center for Disease Control, bullying, data, graphing, percentages, public service campaign
Author
Citizen U DePaul


